UX metrics are a must for sustained financial success
Do you plan business metrics religiously but track user behaviour reactively? NPS is not actionable, hence we need better.
How can a company ensure that its growth and profit numbers are sustainable? The simple answer is to truly value the people behind those numbers, aka the customers and the users.
Be like Travel4evaa- Bring UX metrics into your strategy
Travel4evaa (T4e -fictional) was a booming travel startup with impressive customer acquisition and revenue growth numbers. Every strategy meeting and all-hands was centered around these business metrics.
Sure, there were some murmurs from the customer service team about user complaints. The customer success management team reported some early churn as well, but these reports didn’t seem as significant as the business metrics.
Luckily the team started bringing UX metrics into the conversations. When growth, revenue, and churn were juxtaposed with qualitative feedback, task success, behaviour and performance metrics, the company started to see the full picture and plan for proactive, cost-effective, and sustainable growth.
Valuing the user’s experience improved T4e’s financial standing and built a loyal customer base, ensuring long-term success.
Forming a UX metric program
Often companies put together an NPS program and consider that an effective way of capturing user behaviours and attitudes. But it is not enough and often, not accurate. There is a fair bit of information on the internet about NPS.
In this post, I’ll outline the steps to create a robust UX metrics program.
Goals of UX metrics program
Align UX metrics with business objectives
When UX metrics directly enhance business goals, the user experience becomes a core component of the strategy rather than an afterthought. This alignment helps create products that users love and pay for.
For example, if controlling churn and increasing retention are business priorities, then a good set of UX metrics to monitor is onboarding experience, engagement, usability scores, and sentiment.
Connect UX metrics to financial efficiency
Make operational (OpEx) and capital expenditures (CapEx) part of UX metrics conversation. Classifying UX projects as OpEx or CapEx affect perception in financial statements, influencing stakeholder buy-in and understanding.
For OpEx, metrics can focus on ongoing iterative improvements in user satisfaction or task completion rates. OpEx allows for more frequent adjustments based on user feedback.
For CapEx, metrics could measure the long-term impact of major UX investments on new product exploration, adoption, retention, or loyalty. These investments may carry higher risks but potentially greater long-term rewards.
Want to build a UX metrics strategy? let’s chat.
Use metrics that are measurable
Focus on UX metrics that can be measured and tracked. Metrics should help to understand the ‘why’ and ‘how’ along with the ‘what’ and ‘when,’ offering a holistic picture of the product’s long-term health and trends.
For a B2C product, for example, it’s easy to get a big user base to quantitatively measure onboarding drop-offs or abandoned user flows.
For an enterprise B2B product, however, users don’t onboard that often. A more realistic approach would be onboarding usability test (qualitative) and task completion (mixed methods).
Cultivate a user informed learning culture
Create continuous curiosity for users’ experiences. UX metrics are not just numbers that should be shared periodically but should be part of relevant decision making conversations. This cultural shift ensures that every team member values user feedback and understands its impact on the business.
Guidelines for Implementing UX Metrics
Leverage existing knowledge (Voice of the Customer - VoC)
Before creating new data, collect and analyze existing customer feedback and map it to UX metrics if possible. VoC provides invaluable insights into user experience, forming a solid foundation for improvements.
Combine qualitative and quantitative data
Use both behavioral (primarily quantitative) and attitudinal (primarily qualitative) data to build a comprehensive understanding of the users’ needs and wants.
I have experienced that building a sustained library of only qualitative insights is time-consuming. Balancing quantitative data for confidence and confirmation with qualitative insights for exploration and in-depth understanding is a smarter sustainable strategy.
Define the scope
Clearly define what can and cannot be measured. Focusing on relevant metrics ensures actionable insights that tie in with the current priorities, without getting bogged down by unnecessary data.
Key UX Metrics to consider
Here is a non-exhaustive list of metrics that can be chosen based on relevancy.
Usability Metrics
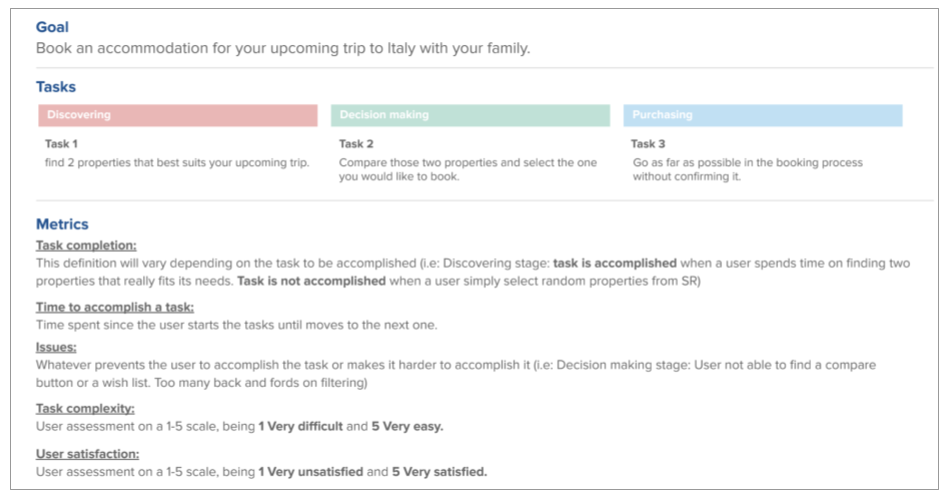
Task Success Rate: The percentage of successfully completed tasks by users.
Time on Task: The average time taken to complete a task.
Error Rate: The frequency of errors encountered during task completion.
Help desk score: effectiveness of inbound user problem solving
Engagement Metrics
Active Users: Tracks daily and monthly active users (DAU/MAU).
Session Length: The duration of user sessions.
Return rate: The return rate of same users
Satisfaction Metrics
Customer Satisfaction (CSAT): Direct user feedback on satisfaction.
Customer Effort Score (CES): Effort required to accomplish a task.
Happiness: Self-reported pleasurable experience.
NPS: Net promoter score.
Retention Metrics
Churn Rate: Percentage of users who stop using the product.
Retention Rate: Users continuing to use the product over time.
Renewal Rate: Users renewing their relationship with the product
Cohort Analysis: Behavior tracking of user groups over time.
Adoption Metrics
Adoption Rate: Speed at which new users adopt the product.
Onboarding Completion Rate: New users completing onboarding.
Supercharge Business+UX metrics
Putting UX metrics with business metrics in a holistic context, creates value greater than the sum of its parts. My favorite part of the metrics process is to uncover these relational insights as this is where the magic happens.
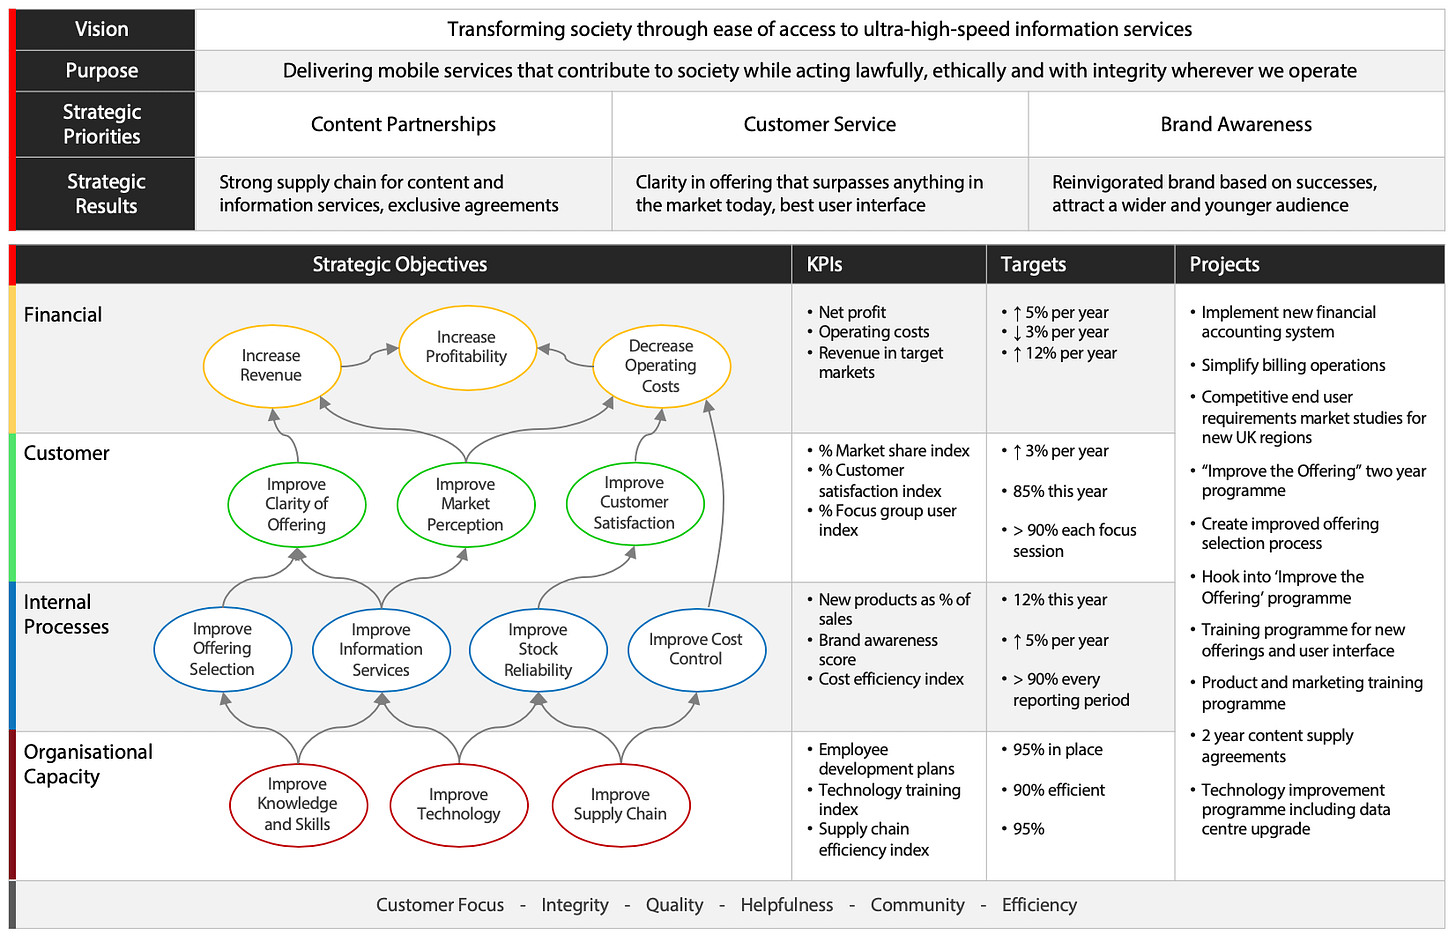
Balanced Scorecard Use a balanced scorecard to map UX metrics to financial goals, customer perspectives, and internal processes.
Journey Mapping Use journey mapping to account for the interconnected nature of the metrics and how they might impact each other.
Sustainable growth and financial success are two sides of the same coin. To be able to monitor and impact both, valuing user experience and aligning UX metrics with business objectives is smart business sense. Companies that strategise for user informed business decisions can create products that users love and pay for.
I am Soma and I collect and make sense of all the necessary user knowledge to help founders and teams make confident growth and revenue decisions. I create product strategies using research, design and systems-thinking toolkits.
What I’m inspired by recently
Johnathan Yogel's full circle story about the trappings of capitalism
FOMO vs FOMU: You’ve heard of Fear Of Missing Out. But what about FOMU?


